Overview of Analytics
In this article, you'll learn about
Log into your Replug account, and on the Dashboard, under Measure Tab, you will have to navigate to Analytics.
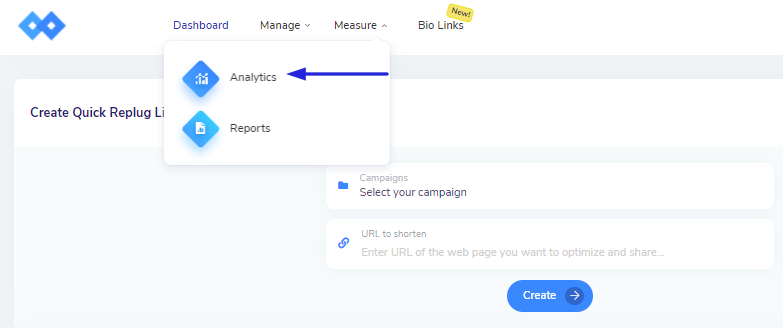
Here, we find detailed analytics for each Replug brand, campaign, or link.
Analytics Views
You can view the Analytics in two forms
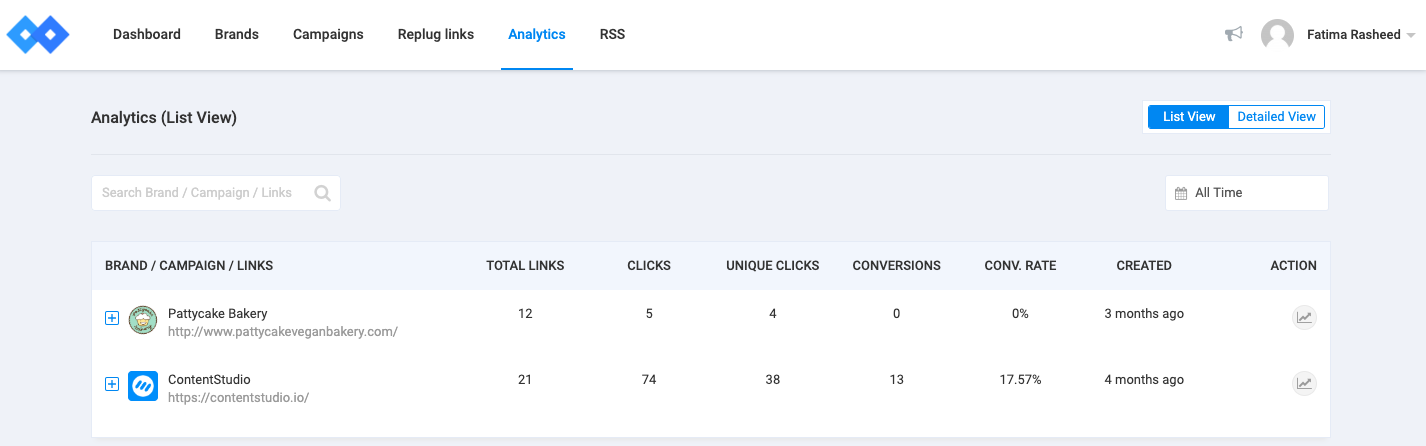
List View
Click on Analytics on the navigation menu. You will see a detailed list of your brands with their total no. of clicks from different links, conversions, and conversion rates.
You can sort based on total links, clicks, conversions, and conversion rates to find out which of your brands are more popular so you can further modify your campaigns to make them more beneficial.
Detailed View
You can find out the detailed analytics for the individual brand, campaign or a link, click on the Analytics Report under the Action column or alternatively you can click on the Detailed View, there you will see collective data like click performance, conversions, and several other demographics for your brands.
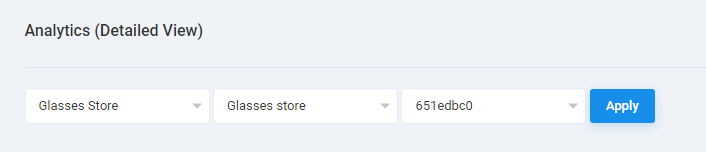
Filter by Brand, Campaign, or a Link
If you want to look at statistics about a particular brand, you need to select a brand name, Campaign, and link. Click on Apply, you will see the overall statistics of the brand which you have selected. It includes the number of clicks an individual brand received and that is how you can evaluate the performance of your brands.
In this step, you are able to use filters to narrow down the results. Click on All-Time on the right side and choose different time frames to track the performance of your brand/ link/ campaign.
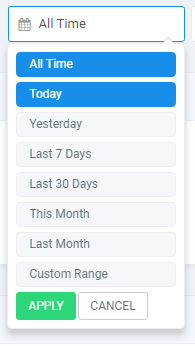
Also, you can apply a Custom Date Range to filter the analytics.
In the Detailed View section, on the right-hand side, you will see the Overview Dropdown menu. Click on it and you can filter the analytics based on Country, Browsers, Operating System, etc.
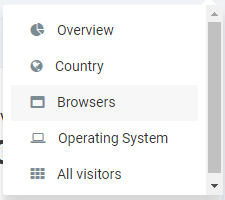
This data will be shown in the form of both graphical and tabular displays.
Was this article helpful?